MISO changed key assumptions in the OMS MISO Survey to show capacity shortfalls.
By not including signed Generation Interconnection Agreement (GIA) projects in the Committed Capacity column, MISO shows a need for capacity.

The background behind the OMS MISO Survey is that MISO runs a capacity auction that only clears capacity for a year ahead. The MISO generator interconnection queue has capacity, but that could only be 2-3 years ahead. So, to understand MISO's capacity needs in each Local Resource Zone (mostly drawn around geographic state boundaries with some exceptions), MISO staff put together a survey with state regulators called the OMS MISO Survey.
The latest 2024 survey results show MISO will have a capacity deficit as soon as next summer.
But if you dig into the assumptions, you will find MISO removed 60,000 MW of generator interconnection capacity from the “committed” capacity column to the “potential new capacity” column and discounted the generator capacity quite a bit.
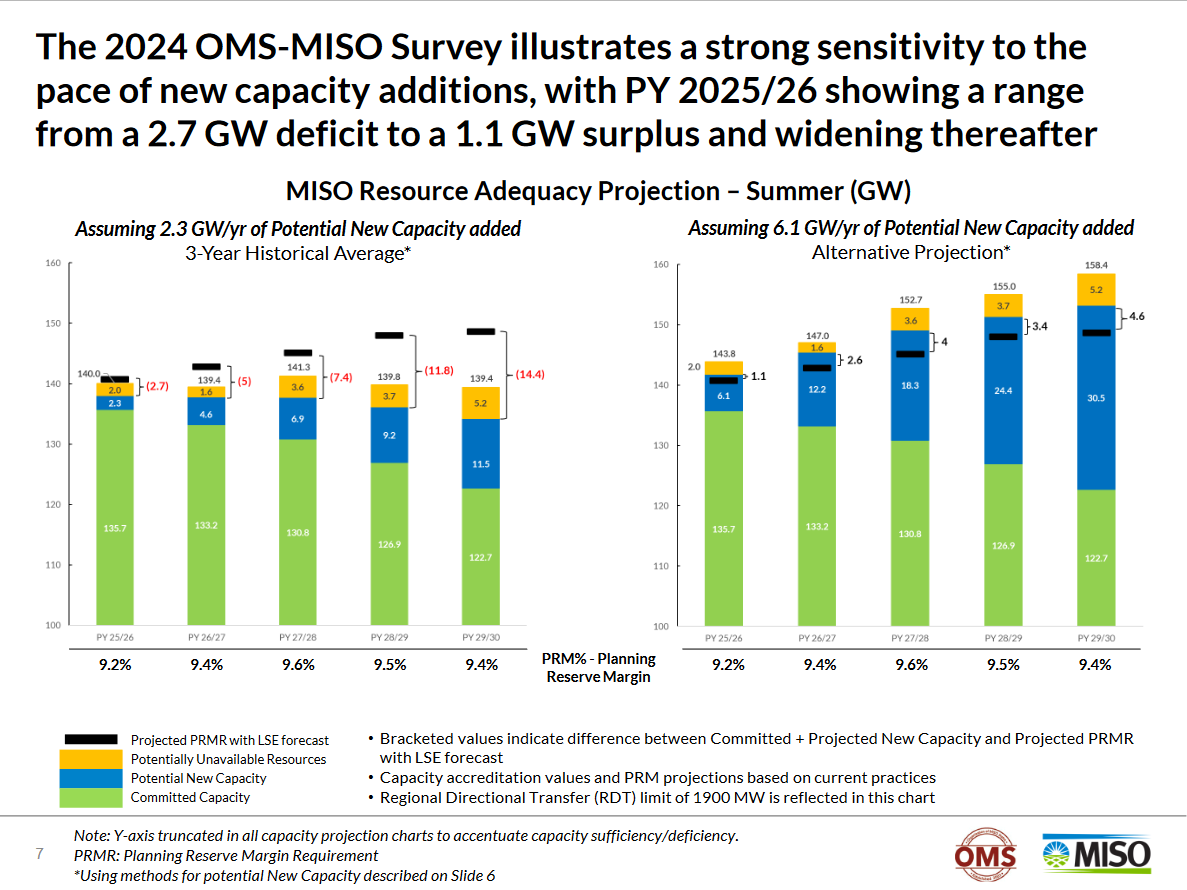
Source - slide 7, 2024 Survey
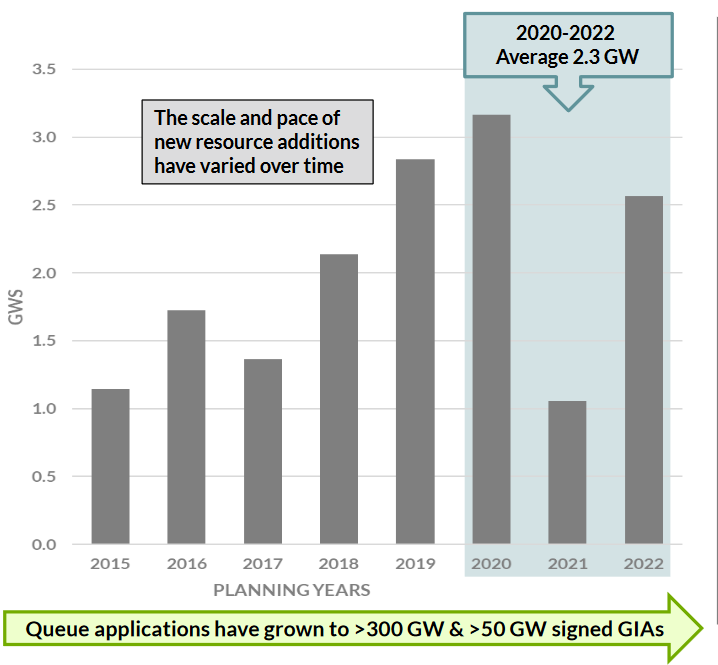
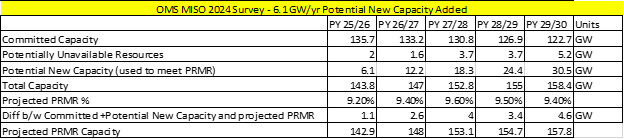
Don’t get fooled by the potential new capacity addition scenarios of 2.3 GW/yr and 6.1 GW/yr. MISO says generator interconnection capacity is not being built even though generators have signed an interconnection agreement. The chart below shows that, on average, only 2.3 GW was built during the COVID years (2020-2022). For 50 GW of signed interconnection agreements, MISO is only counting 2.3 GW. That’s only 4% of signed GIAs.
Source - slide 5, 2024 Survey
Last year, MISO applied the following logic to treat generators in the interconnection queue -
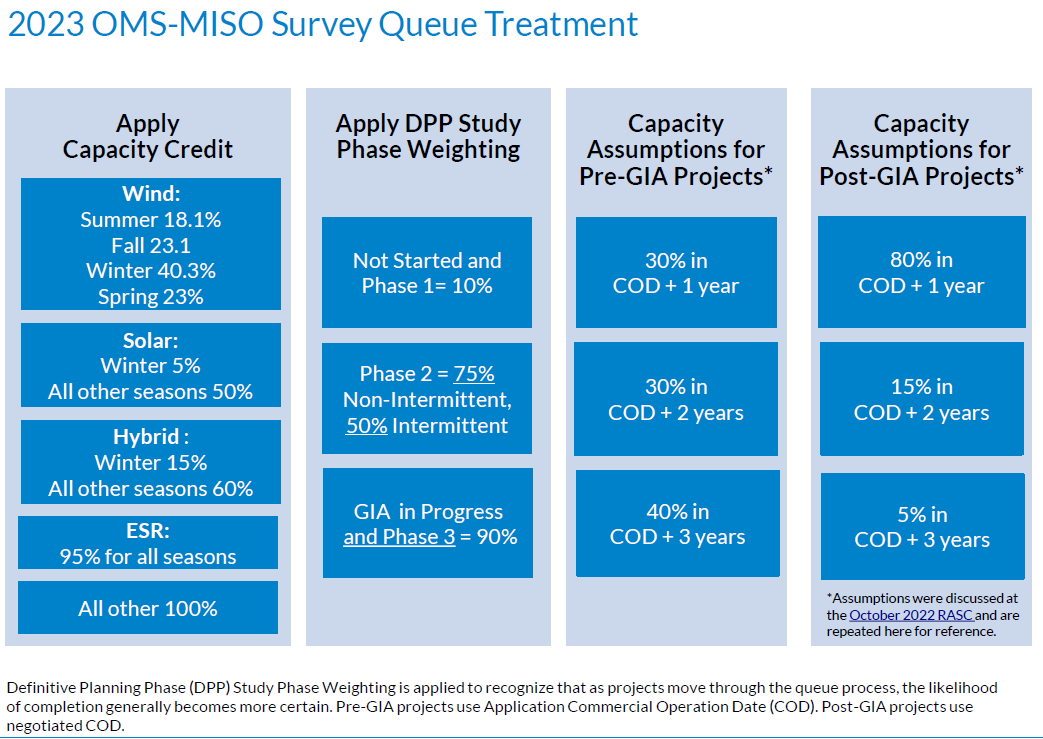
Source - Slide 18, 2023 Survey
The impact of that change is shown below -
The first table is from the 2023 Survey -
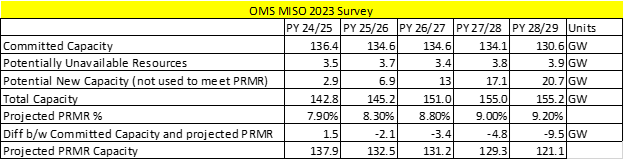
If you add the “Potential New Capacity,” it is 60,000 MW.
Now, see the table below from the 2024 Survey -
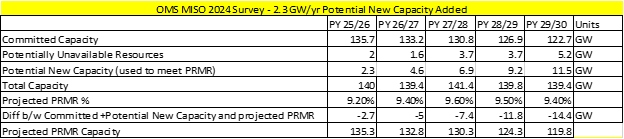
If you add the “Potential New Capacity,” it is only 34,500 MW.
Yes, MISO provides another scenario in the 2024 Survey, showing a “Potential New Capacity” of 91,500 MW.
But, the damage is done.
That’s not the only change.
Look at the Zonal chart in the 2023 Survey -
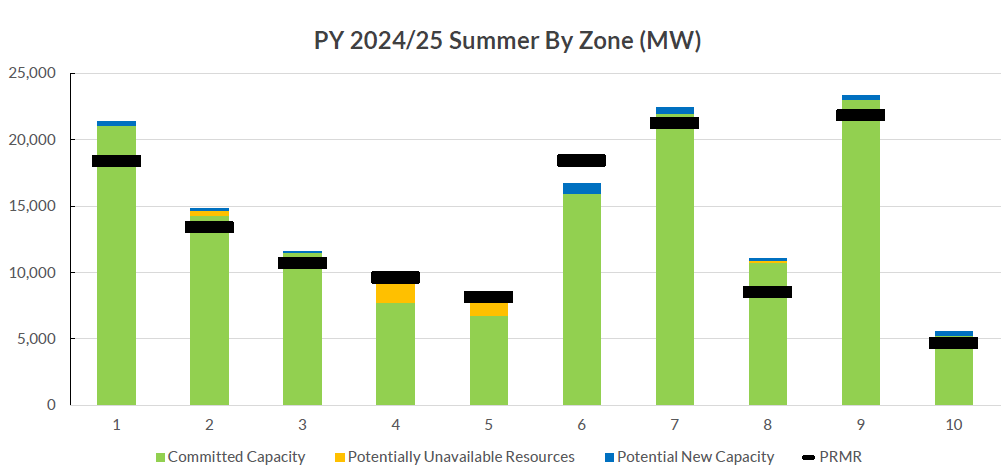
Source - Slide 23, 2023 Survey
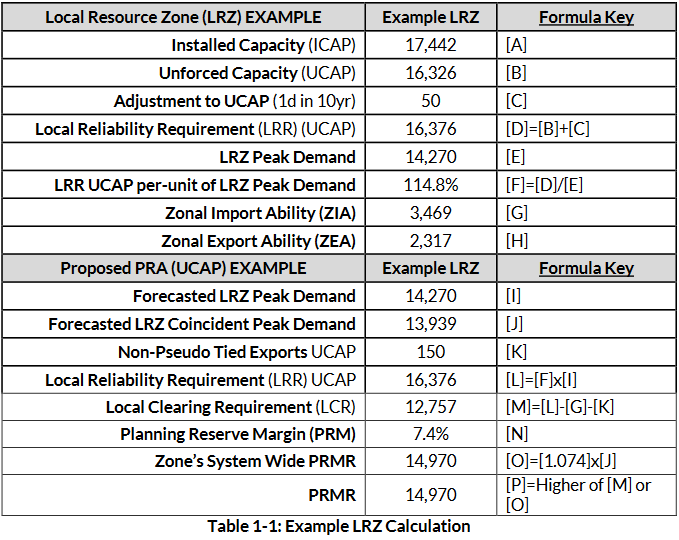
Notice it is PRMR—that’s the black line. Most zones have enough capacity (the black line is consistently lower than the green bar) except for Zones 4, 5, and 6.
Now, look at the 2024 Survey, same chart -
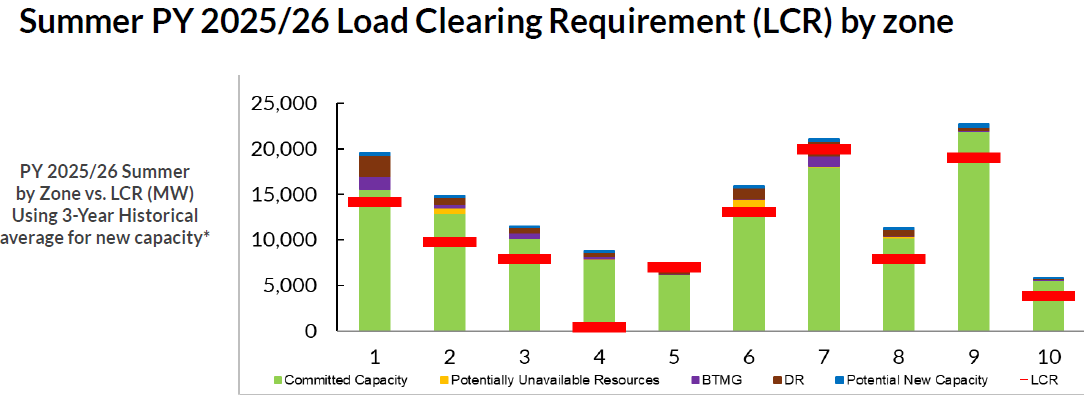
Source - Slide 26, 2024 Survey
You notice two things right away - 1) the color has changed, a red line instead of a black line, 2) the metric has changed too! PRMR went away from LCR and came into the picture.
Here’s why that is important -
Source - MISO 2023-24 LOLE report
You notice the LCR - Local Clearing Requirement is more restrictive than the PRMR - Planning Reserve Margin Requirement.
If MISO does not count generator interconnection capacity and adds a more restrictive metric (local clearing requirement) instead of the planning reserve margin requirement - then no wonder we need a need for new capacity.
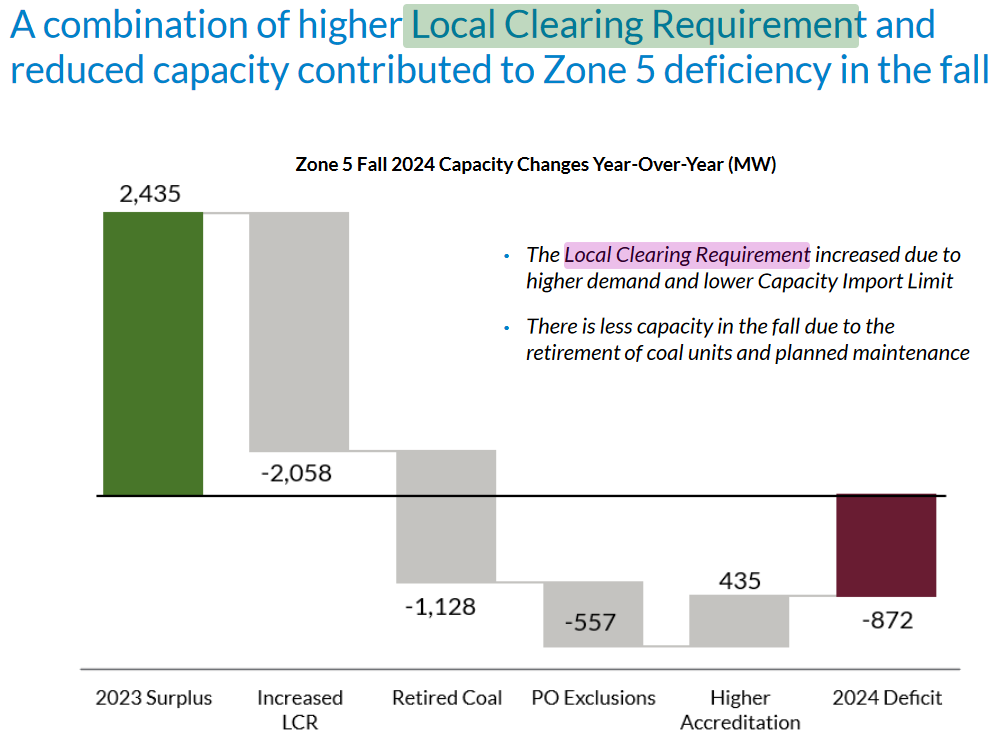
MISO’s recent auction results could explain why MISO changed from PRMR to LCR.
See below -
Source - Slide 5, MISO 2024 Auction Presentation
Zone 5 (Missouri) had high price in the Fall Season in the last auction due to an increase in local clearing requirement. That could explain why MISO is using LCR instead of PRMR.