

MISO’s Reliability Risk Just Magically Improved — Or Did It? What NERC’s Summer 2025 Report Tells Us.
NERC - “We regret the error, but also... look at what MISO gave us.”

One minute MISO’s grid is teetering on the edge, the next it’s sitting on a comfy 26.1% reserve margin. What happened? According to NERC, last year’s alarm bells were based on bad data — courtesy of MISO. In a move that’s equal parts accountability and finger-pointing, NERC is now correcting the record and making sure everyone knows MISO submitted the mismatched numbers. Think of it as: “We regret the error, but also... look at what MISO gave us.”
This post unpacks the data drama, explains how reserve margins leapt 9 percentage points in six months, and questions whether we’re measuring reliability or just massaging spreadsheets. Spoiler: Even the independent market monitor isn’t buying it. And if this is what triggers emergency orders to keep old coal plants online, maybe the real reliability risk is in the modeling.
What Changed Between the 2024 LTRA and the 2025 SRA?
The most notable change is MISO’s anticipated reserve margin:
17% in the 2024 LTRA
26.1% in the 2025 SRA
That 9.1 percentage point jump deserves attention.
On the demand side, the Total Internal Demand increased from 122 GW in the 2024 LTRA to 125 GW in the 2025 SRA. After accounting for demand response, the Net Internal Demand rose from 114,123 MW to 116,309 MW. That 2,000 MW increase is straightforward and likely reflects updated data submitted by market participants in early 2025.
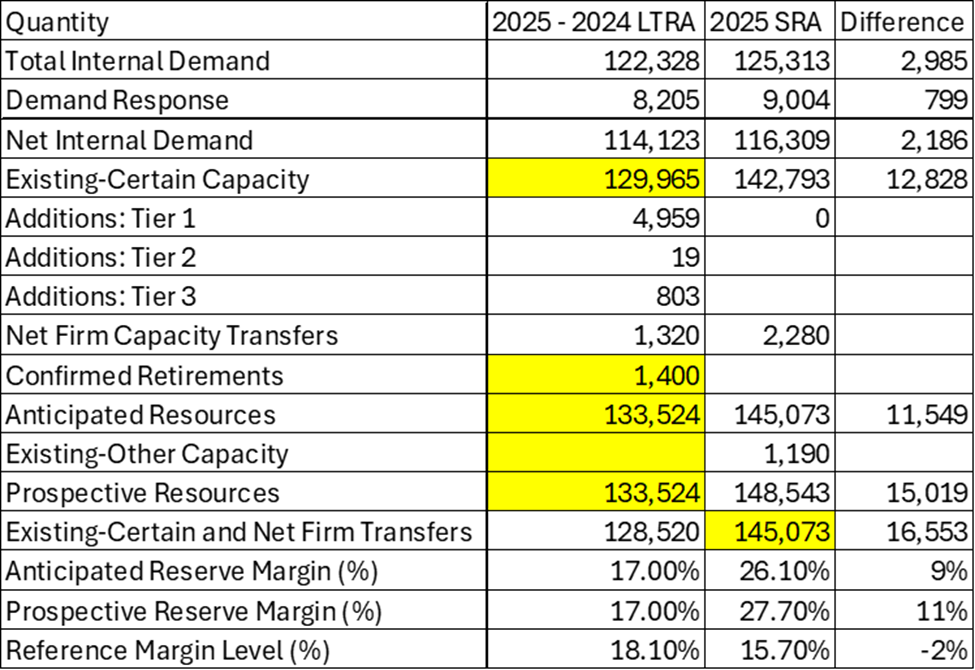
Source: Rao Konidena based on NERC 2024 LTRA and 2025 SRA, highlighted cells are calculated values.
But the capacity side tells a more puzzling story.
The Role of Definitions: Anticipated Resources
The jump in reserve margin appears to hinge on how NERC defines Anticipated Resources in each assessment:
In the SRA, Anticipated Resources include:
Existing-Certain Capacity
Tier 1 Capacity Additions
Net Firm Capacity Transfers (Imports minus Exports)
In the LTRA, Anticipated Resources are the same minus Confirmed Generator Retirements.
That difference matters. NERC notes that 1,400 MW retired in MISO since the 2024 SRA. But because the 2025 SRA doesn't subtract confirmed retirements, it paints a more optimistic capacity picture.
Using the SRA’s 26.1% reserve margin and 116.3 GW Net Internal Demand, MISO appears to have 145 GW in Anticipated Resources this summer. That suggests an increase of 11,500 MW in six to twelve months compared to the LTRA estimate.
So Why Did DOE Cite the SRA?
The U.S. Department of Energy recently issued an Emergency Order requiring that Michigan’s Campbell coal-fired unit stay online. Interestingly, the DOE order cited the 2025 SRA, not the more conservative 2024 LTRA.
That begs the question:
If MISO has 145 GW of anticipated capacity, why is a 1,560 MW unit in Michigan essential to reliability this summer?
The answer may lie in local constraints or transmission limitations, but at face value, the capacity data doesn’t justify the urgency.
Expert Pushback: Is NERC Overstating the Risk?
At a recent FERC technical conference on resource adequacy, David Patton, president of Potomac Economics and independent market monitor for MISO, challenged the very foundation of NERC’s reliability assessments.
Patton argued that NERC understates MISO’s true capabilities by ignoring more than 8,000 MW of demand response, behind-the-meter generation, and firm imports. He also criticized NERC for including plant retirements that haven’t actually occurred, artificially deflating MISO’s resource count.
In Patton’s view, MISO is not only not at risk — it's one of the most reliable regions in North America. “If I was concerned about the lights going out somewhere, it would not be MISO,” he told FERC.
Even more striking, Patton took aim at MISO’s own planning process, calling its projection of needing 17 GW/year of new resources “clearly flawed.” He noted that if utilities build hybrids and dispatchable resources, the actual need could drop to just 2–3 GW/year.
This raises a critical point: if both NERC and MISO are relying on outdated assumptions or failing to reflect evolving resource mixes, how trustworthy are the headline reserve margin numbers?
PJM and Demand Response: A Useful Contrast
Consider PJM, which has:
182 GW forecasted capacity
158.7 GW extreme peak demand forecast
146.2 GW 50/50 peak forecast
Even with higher demand, PJM expects to rely on demand response during extreme conditions. NERC explicitly states this in the 2025 SRA:
"During extreme high temperatures that can cause record demand, PJM anticipates the need for demand-response resources to help reduce load."
Yet MISO, with a 26.1% reserve margin, gets an Emergency Order to keep one fossil plant online.
Demand Response: Still Underused?
Inconsistencies in how NERC reports demand side management data make cross-region comparisons hard. So I created a chart showing Demand Response as a % of Total Internal Demand based on 2025 SRA data.

Source: Rao Konidena based on NERC 2025 SRA Data -Demand and Resource Tables.
Some questions jump out:
Why is SPP’s DR percentage so low compared to MISO or PJM?
Why is NYISO’s and ERCOT’s available DR also behind?
These are questions regulators should be asking. If resource adequacy is improving because of reporting changes, not actual reliability improvements, then demand response must be re-centered in our summer planning efforts.
Final Thoughts
MISO's improved risk designation in the 2025 SRA seems less a result of fundamental changes and more about changes in reporting methodology.
That’s not necessarily a bad thing — transparency about assumptions is always helpful. But when a region jumps from a 17% to 26.1% reserve margin in six months, we need to pause and ask what really changed — and who decides what counts.
As FERC heard recently, some of the most respected voices in resource adequacy think the models are flawed, the forecasts are opaque, and the emergency orders premature. That’s a reliability risk all its own.
Sources:
Charts and calculations by: Rao Konidena